How to Become a Lean, (Mean), Metrics Machine

               My pick: Lean Analytics by Alistair Croll and Benjamin Yoskovitz
               Approximate read time: 8 minutes
I can’t say we all know metrics are important. So, I’ll start with this: Everyone who’s used metrics understands their importance. They help us track our business, report our progress, guide our decisions, and reveal insights that can easily be hidden in the noise of day-to-day operations.
The fact is, many of the companies I’ve worked with had never used metrics as a tool before. It just hadn’t occurred to them to look beyond the broad brush-strokes of things like daily sales, number of customers, or quantities sold. Those accounting measures won’t teach you how to get closer to your goals, nor point reliably toward something that will change your behavior. That’s what analytics is all about: measuring our progress toward business goals.
The best resource I can recommend on the subject is Lean Analytics by Alistair Croll and Benjamin Yoskovitz. The book has an emphasis on startups; but whether you’re starting a business, just now starting to track data, looking to pivot, or developing strategy, this book is for you. Lean Analytics covers the Measure and Learn step in the Lean Startup Build, Measure, Learn model. The model prescribes quick iteration, finding the right customers, and learning from them to fine-tune the business plan. 
Startup or not, there’s much to learn from startup methodology.  
Consider this:

A startup doesn’t have years of data. It’s still trying to figure out who its customers are and what they want. Everything is in flux, so the business is frequently changing what’s being measured anyway. What’s more, if it’s a business in a new industry or market, there are even more unknowns, not to mention unknown unknowns- what doesn’t even appear on the radar, but is the most relevant precisely because that’s what will help it discover an unfair advantage and disrupt the market.
For a startup, measuring progress toward business goals means finding product/market fit before the money runs out. A pressing question would be, “what do our customers really want?” More often than not, customers don’t know the answer themselves. That’s why we use metrics- so we know that what we’re building is something people actually want to buy, and we’re not just operating on lunacy and burning through our cash chasing our own hallucinations. 
This is what Lean Analytics is all about- finding the meaningful metric, then running experiments until the numbers are good enough to move on to the next idea, to learn how to build a scalable and repeatable business model.
Data→Metrics→Decision

Get outside the building.

Everything can be measured, it’s measuring the right things that will drive the changes we’re looking for. Measuring data effectively requires understanding the data- its quality, constraints, which of it not to use, and its place in a larger context so we’re able to exploit any relevant information we can get out of it. After that, it’s a matter of picking the right metric. 

A good metric:

Is comparative. Comparing a metric to other time periods, groups of users, or competitors shows you which way things are moving.

Is understandable. If it’s easily understood by everyone, it’s easier to implement and disseminate throughout the organization.

Is a ratio or a rate. It should be understood at a glance. Ratios make the best metrics. They’re easier to act on, and inherently comparative.

Changes the way you behave. It should make your predictions more accurate, and help you optimize the product, pricing, or market.
There are several different kinds of metrics, and things to keep in mind for each:

Qualitative versus Quantitative metrics

Qualitative metrics provide insight, but lack hard numbers- Impressions, emotions, things that are subjective and imprecise. Think the things that we get from an interview. The first data a startup gets is usually of the qualitative kind. Quantitative metrics are the hard numbers- measurable, precise, easy to aggregate.

Vanity versus Actionable metrics

Vanity metrics make us feel good but don’t do a damn thing for the company. You got 100 visitors, congratulations. Or was that one person visiting 100 times, hmm? Vanity metrics don’t change your behavior and can be downright dangerous. Actionable metrics, now there’s a metric you can spank and send on its way. An actionable metric changes your behavior towards a better course of action. As another example, how many users you have only tells you how popular you are. Popularity contests won’t make you money. Look instead at the number of actual users.

Exploratory versus Reporting metrics

Exploratory metrics are speculative and can lead to unknown insights, while reporting metrics report normal, managerial stuff. A reporting metric in a bar, for example, might compare the numbers of Manhattans to Old Fashioneds sold. An exploratory metric might be used to compare the sales per ticket of tequila drinkers to Vodka drinkers to determine which spirit will dominate the back bar, or if one will be done away with completely to cater to a specific clientele.  

Leading versus Lagging metrics

Once a company has enough data, it can begin to formulate a predictive understanding of the future, using leading metrics. These are indications of things that are likely to happen. Lagging metrics explain the past, it’s measuring old news. Churn is the perfect example of a lagging metric. If you’re losing customers, it’s obvious something’s got to change. Unfortunately, the loss has already occurred and the customers are unlikely to come back. Complaints is often a leading indicator of customer abandonment. Diving into that problem could lead to enlightening answers to your abandonment issues.  

Correlated versus causal metrics

Correlated metrics may rise and fall together, but not necessarily because one has an effect on the other. Turns out higher GDP has a negative correlation with penis size. I’ll just leave that right there. If one metric actually causes another metric to change, they’re causal. It’s found by finding a correlation, running controlled experiments, and measuring the difference. Causality, even a small degree of causality, is analytics-sexy.

Measure What Matters

Every startup goes through the stages of problem discovery, building, testing, attracting customers, and collecting money. For each stage there are key metrics- to align goals, maintain efficiency, and avoid the disaster caused by moving to the next stage prematurely.
Is the business developing its MVP (the minimum viable product for innovators and early adopters)? Determining what additional minimum feature sets are needed for main market adoption? Increasing stickiness or conversion? By using the right metric for each phase of business development and growth, we get the information we need to change the way we behave, to drive the changes we’re looking for.
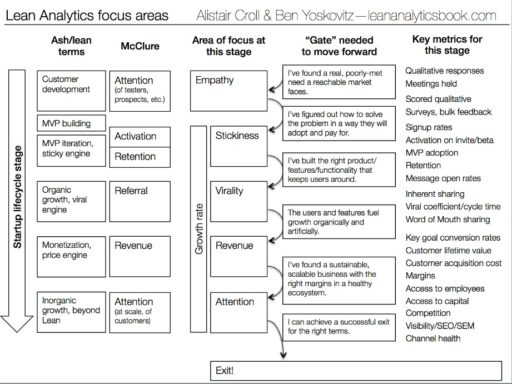
There are several frameworks built around all of this, many covered in Lean Analytics. Of note is the Lean Analytics Stages and Gates, developed by Croll and Yoskovitz that combines what they believe are the best of these models, and structures a good portion of Lean Analytics. Whatever the stage, there will be one metric that matters most.
The Lean Analytics Stages and Gates Model

The One Metric That Matters

Your business will track a lot of numbers. It’s important that we’ve got a good understanding of what parts of our business are looking like relative to others, and capturing as much of the information as possible can only help. Some, like our key performance indicators (KPIs)- the numbers that drive the business, will be reported every day. But it’s easy to get lost in over-analyzing, particularly when we’re still figuring things out and trying to make sense of it all. This is where the One Metric That Matters (OMTM) is important, the single most important metric at any given time.
The OMTM changes depending on the stage of the business and the industry. It’s the one metric that everyone on the team knows and understands. It’s in the daily emails, it’s on the screens on the wall, it’s the focus of the team’s efforts. Having the OMTM is what keeps us focused and on the rails. The OMTM is the number that the survival of the company depends on. It is the number that reflects the greatest risk at any moment for the company (The LASG framework is helpful here). 
Picking the target number for the OMTM is notoriously hard but absolutely essential. Without it, you’re in the desert without a compass. You may be doing good…would you say good enough to see you through to the next stage before burning through all your money good? How many drinks per customer per hour do you need to sell against staffing and fixed costs? How many new activations relative to free sign-ups? Draw the line in the sand, and get to it.
There’s an art to collecting excellent data. Designing interview questions, eliminating biases, the setting of the interview…In the early stages of business and product development there’s no substitute for one-on-one interaction with individuals from the target market. A conversation over a cup of coffee can radically change your understanding of your product in peoples’ lives. Your vision cannot neglect the human element, your business depends on it.
Short of having a close, personal relationship with each one of your customers, and relying on them getting together regularly over tea to come to a consensus about how they could best benefit the company, analytics is the best resource we have for learning about the people that are paying the bills and validating the business model.
With our focus constantly shifting as we’re figuring it all out (and constantly iterating), it would be nice to know how different groups are behaving with changes over time. That’s why tools like cohort analysis are important. They offer a much clearer perspective and tell us what metric to focus on. Cohort analysis, A/B testing, and multivariate analysis will be covered in later posts. 
####

Why this book is my pick

Croll and Yoskovitz do a nifty job explaining where to start- gathering relevant information, using the right metrics to act upon, and finding the OMTM so you know if your pivots are working. Their “flipbook” spotlights six business models representing six different kinds of businesses. For each, their key metrics, user flows with key metrics at each stage, case studies, examples of relevant tables with calculations, even indications of fraud and how emails may be being blocked- and so much more. Very cool stuff.

For what could easily be a bone-dry book given the subject matter, Lean Analytics is super approachable and engaging. It’s not all quantitative, data scientist stuff (not what I expected, but a little relieved nonetheless). True to other Lean Startup works, it’s written for the entrepreneur, with no presumptions about the audience having experience with the subject matter. The book is packed with case studies, examples, and visuals that make understanding concepts and calculations a snap. The amount of information and considerations presented in this book is astounding. It’s enlightening to see what can be measured with a little ingenuity. Nearly anything can be given a value- start keeping score.